
The Social Map uses the WGS 1984 geographic coordinate system. When uploading your spatial data layers, your files will automatically be converted into this system.
Map layers can be added from .shp or .geojson files. To add layers via GeoJSON or Shapefile:
- Navigate to the 'Layers’ tab and and select 'Add Layer’.
- Choose either ‘GeoJSON’ or ‘Shapefile’ from the dropdown.
- Name your layer and upload the file.
- Select the blue ‘Save’ button to save your layer.
- Select the blue ‘Save Social Map' to apply it on the Social Map.
When working with the shapefile format, it is important to note that these are comprised of multiple files, that necessarily include .shp, .shx and .dbf, but can also include a variety of optional files with different formats. To use shapefiles within Social Pinpoint, all relevant files must be converted to a .zip file in order to be used within the mapping tools.
💡User Tip: If you want to draw your own data layers, but don’t have GIS skills or software, you can use this free tool. It helps let you easily draw point layers, lines or polygons. Simply sketch the features, save as .geojson and upload into Social Pinpoint.
Custom data layers can be added to the base map to provide further information and context to the visitor. Points, lines and polygons can all be added to the Social Map. To add custom layers:
- Give your layer a name in the provided field.
- You will be presented with a map, which you can enter an address into to refocus to your desired location. You can use the scroll and zoom functions provided to see more detail.
- There are three shapes on the right hand side of the map:
- Linestring allows you to draw lines on your map or create shapes using lines.
- Polygon allows you to create polygon shapes on your map.
- Marker allows you to drop a pin at a particular point of interest. - Once you have defined your layer you can create a pop-up with information and/or an image. Under Feature Collection, select Edit Feature Info and fill out the relevant information.
- Once you have defined your layer, you will be able to adjust the stroke color, width and opacity, as well as fill color, fill opacity and dash array.
- When you are finished, select Save Layer.
You can add plans, diagrams or other images to your Social Map as custom layers. These images can be positioned visually or placed using exact georeferenced coordinates. Image layers are useful for providing spatial context, such as proposed developments, master plans, or marked-up diagrams.
When adding an image layer, you can choose between two modes:
- Draw Mode (default) – Position and shape the image directly on the map using intuitive, on-screen controls.
- Manual Mode – Enter exact coordinates through the Advanced settings for precise placement.
Draw Mode
Draw Mode lets you adjust an image layer directly on the map. Once the image is added, control handles will appear so you can move and reshape the image intuitively.
Supported adjustments
- Move - drag the image to a new location.
- Scale - resize by dragging corners or edges.
- Rotate - use the rotation handle.
- Skew / Free Transform - adjust individual corners to fit irregular shapes.
How to Use the Draw Mode Feature
1. Add an Image Layer
- Go to the 'Layers' section > Add Layer > Image
- Upload an image from the File Manager
2. Adjust the image on the Map
- Custom handles will appear around the image so you can rotate, move and resize it visually
3. Keyboard Shortcuts
- Free transform / skew - ( Ctrl + Drag corners )
Allows independent corner adjustment (corners highlight in orange)

- Unconstrained movement (Shift + Drag edge midpoints)
Resize along an edge without keeping proportions
- Undo ( Ctrl + Z )
- Redo (Ctrl + Shift + Z)
Manual Mode: Geo-Referenced Image
Manual Mode allows you to position images using exact coordinates. This provides spatial accuracy when the visual alignment of Draw Mode is not sufficient.
To add a geo-referenced image to the Social Map:
- Go to the 'Layers' section > Add Layer > Image
- Enter a name and upload your image (jpeg, png, or gif).
- Open the 'Advance Settings
- Enter the 'Coordinates' which are the latitude and longitude coordinates of the image to position the corners correctly over the map.
- The Social Map uses the WGS 1984 geographic coordinate system.
- Select the blue ‘Save Layer’ button to save your layer.
Placing an image on the Social Map you'll need 'two points':
1. Top-left point – latitude and longitude
2. Bottom-right point – latitude and longitude
If you need greater accuracy, enable Define all corners to enter coordinates for all four corners individually.
Important Notes
- Images should be north-facing to display correctly.
- The coordinates N and W refer to the Latitude and Longitude of point 1.
- The S and E refer to the Latitude and Longitude of point 2.
How would I get these coordinates?
There are a couple of tools you can use the most common mapping system would be Google Maps.
Selecting a point in the map would show the coordinates for that specific point in a small pop-up window (see image above), once you have the proper coordinates for the top point you can repeat to get the bottom point coordinates.
🎯Key Actions
Styling data layers and legends
Once data layers have been added you can adjust their visual style and add items to a legend to denote what each layer symbolizes. The following style properties can be adjusted:
- Fill Color - Determines the color of the main feature.
- Fill Opacity - Determines how opaque or transparent the feature color will appear.
- Stroke Color - Determines the color of the outline around the feature. If no stroke is desired, select the ‘X’ button in the color picker.
- Stroke Opacity - Determines how opaque or transparent the outline color of the feature will appear.
- Dash Array - Provides the ability to style the pattern of the feature’s outlines to create ‘solid’ lines or ‘dotted’ or ‘dashed’ line’. This is expressed as two numbers, separated by a comma. The first value determines the length of the ‘dash’ and the second value determines the length of the ‘gap’. A solid line is expressed as ‘1,0’, where a dotted line would be expressed as ‘1,1’. A dashed line would be expressed as ‘2,2’ or ‘3,3’ for a slightly larger dashed line.
- Stroke Width - Determines the size of the outline around the feature from 0 -10 pixels.
Once a data layer has been added, you can add a symbol to the legend that lets the user know what each layer represents. Legend items must be manually created, and a single layer can have more than one legend item (which can be useful if adding multiple features in a single layer from Carto).
Currently, legend symbols are only displayed as simple circles with an adjustable fill and stroke color.
To add and style a legend item:
- After adding a data layer, select the ‘Add legend item’ link next to the layer name.
- Give the legend item a unique name (up to 35 characters) and set its stroke and fill color which will be used to style the legend symbol.
- Select the ‘Save Legend’ Button.
- To add multiple legend items, repeat the process.
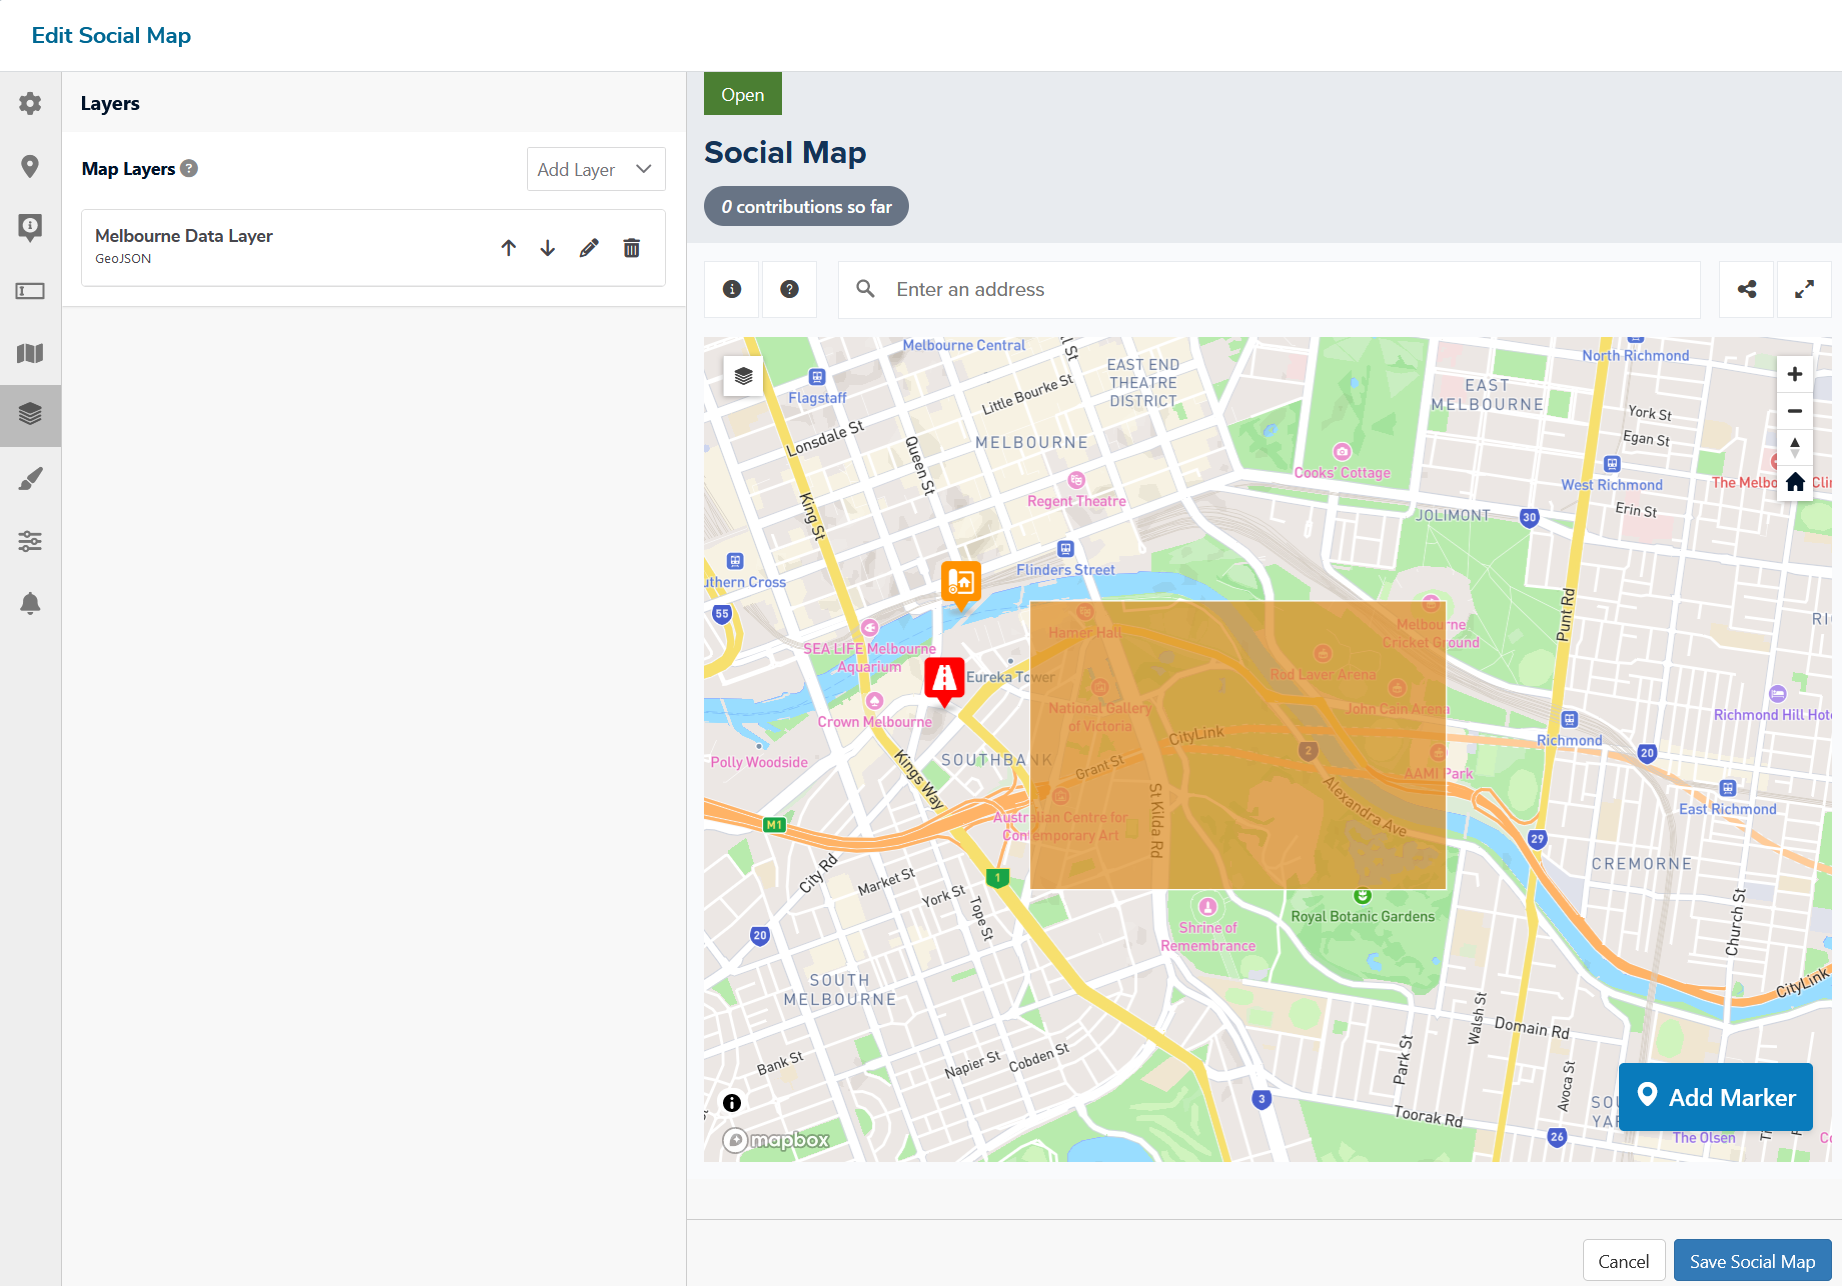
Add a Masking Layer
The masking layer feature provides a powerful way to highlight a study area or features on a map, and can also be used to restrict user contributions to a defined geographical area.
The masking feature works by adding a spatial data layer which will be used to define the masking area. By default, the mask uses the uploaded geometry to ‘cut-out’ an area from the mask shape as if it was a cookie cutter. This allows you to style the areas outside of the original shape by styling the masking layer.
The masking layers will sit above all other data layers that are added to the map. Up to seven ‘features’ can be included in the masking layer - anything more than this will cause the page to crash.
To add a masking layer:
- Select the target Social Map and select ‘edit’ to open the Block Settings.
- Go to the ‘Layers’ tab and select 'Add Layer' and scroll down to ‘Mask’.
- Name your masking layer.
- Upload either a GeoJSON or Shapefile.
- Style the masking layer by adjusting its stroke (color, width, opacity and dash array) and fill (color, width and opacity).
- Choose a fill color, width and opacity.
- Select the blue ‘Save Social Map' to apply it on Social Map.
The masking layer can also be ‘inverted’ which will allow you to style the original shape that was uploaded. To invert the mask, select the ‘invert mask’ checkbox.
To restrict participants from dropping pins outside of the mask, select 'Restrict markers to mask'.