
The reporting section for the Form tool has many different views and features based on the question types used. Navigate this article here:
- Accessing detailed Form Reports
- New! Form Reports Filtering 🆕
- New! Show/Hide Questions in Summary Report 🆕
- Summary
- Overview
- Data
- Analysis
See example reports and key notes at the bottom of this article.
Accessing detailed Form Reports
Steps to access a Form Report
- Go to the "Dashboard" > "Reports".
- Select "Results" in the left-hand menu.
- Find your survey in the list and click the 'View Results' link.
- Select the desired date range from the dropdown menu at the upper-right of the report. By default, the last seven days are shown.
The form report has four sections:
- Summary - Shows the results of your forms and surveys using summary tables and dynamic visualizations.
- Overview - Shows meta-information about the activity, including when participant's left contributions, what devices they used, and known demographic information for registered members.
- Data - Shows results in a tabular format that can be exported in .xlsx, .csv and .pdf formats.
- Analysis - Lets you view text-based responses to open-ended questions and use text analysis tools.
🆕 Form Reports Filtering
The Form Tool includes additional filters that offer more detailed insights, allowing users to create tailored views of specific responses and trends.
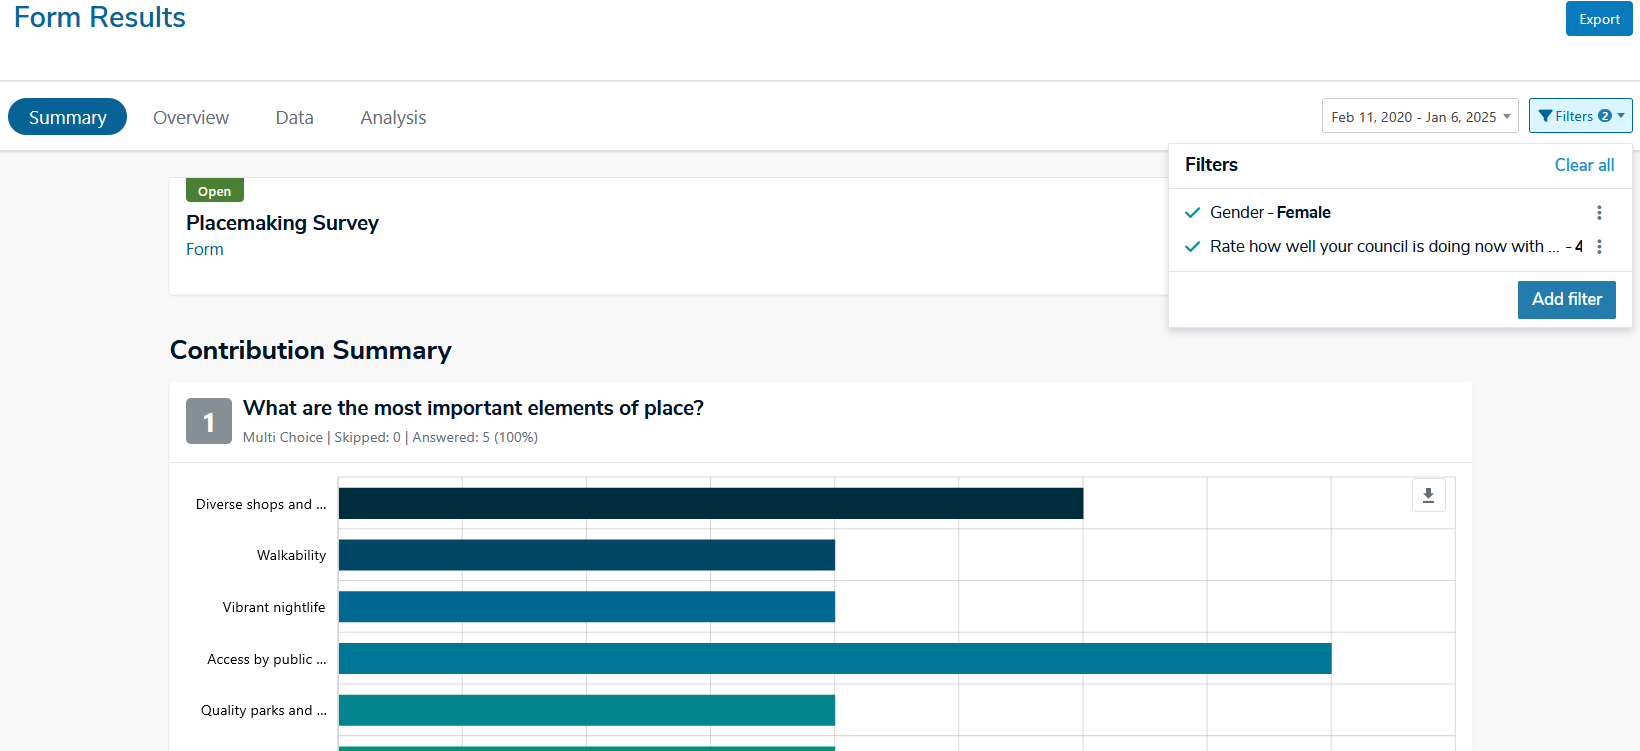
- Filter by specific form data/questions (e.g. multiple choice, text fields, Contribution ID).
- Member profile filters (e.g. username, email, postcode).
- Multiple filters can be applied together for refined results.
- Filters persist across all reporting tabs (Overview, Summary, Data).
- Filters apply to exports, keeping reports consistent with on-screen data.
- Overview/Summary exports display active filters for transparency.
🆕 Show/Hide Questions in the Summary Report
Now you can choose which questions you want to show or hide in your Form's Summary Report, allowing for greater flexibility to customize your reporting.
- Hide or show individual questions directly within the Summary Report page using a toggle button.
- Hidden questions are visually greyed out in the interface.
- Hidden questions are excluded from PDF exports (note: question numbering is maintained per the original Form). The contents page lists applied filters.
-
A new eye icon button allows toggling visibility (open = visible, crossed out = hidden).
How to hide questions:
- Go to the 'Summary' tab of a Form in reporting.
- Each question block has a visibility button in the top-right corner:
- Show question → visible on screen, included in PDF
- Hide question → greyed out on screen, excluded from PDF
- Hover over the button for a tooltip explaining its behavior.
- Click the button to toggle between Show question and Hide question.

Restoring/showing the hidden question is simple: click "Show Question".

📃 Summary
The Summary section shows the results for each question in a form or survey, illustrating findings through dynamic visualizations and summary tables.
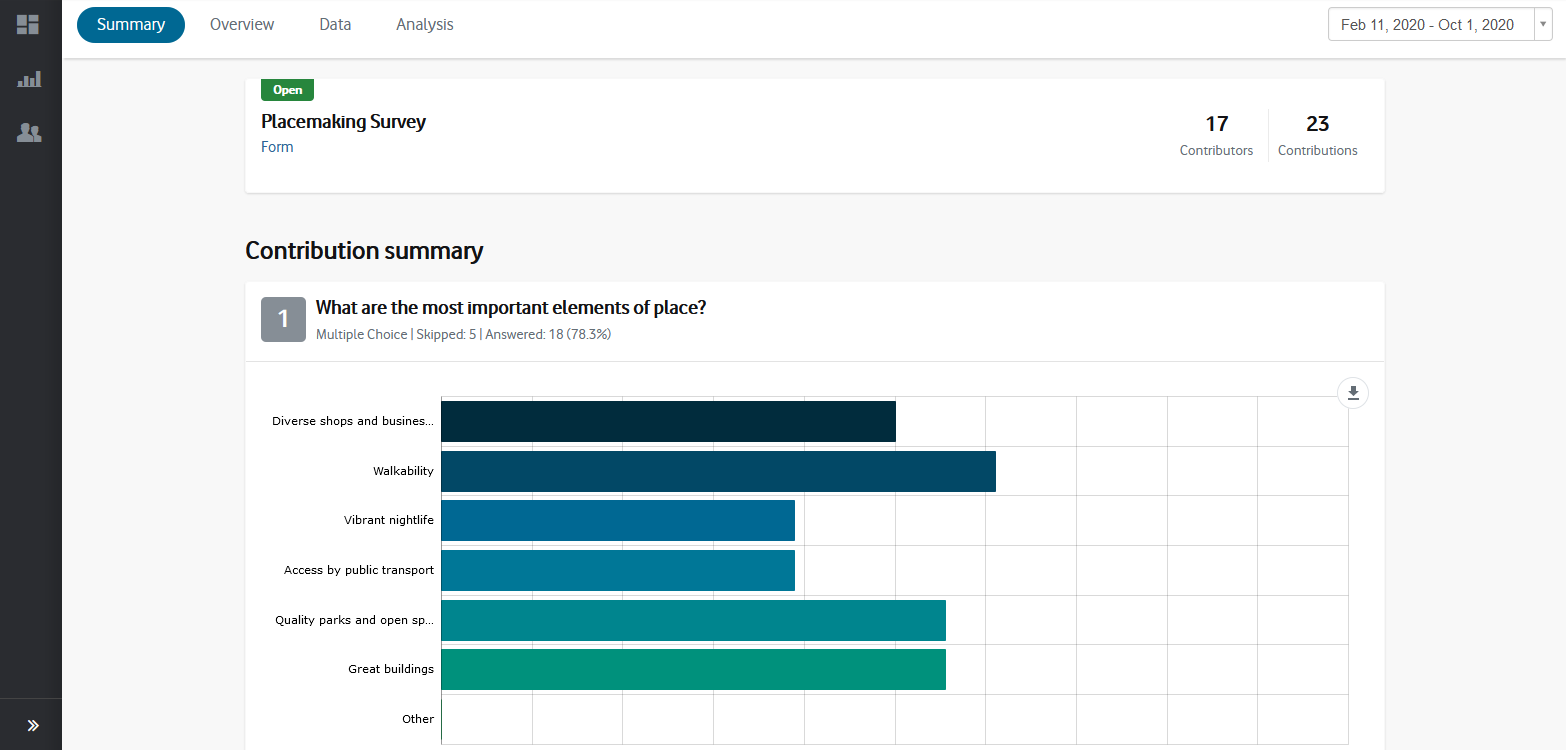
⬇️ You can export the report as a .pdf by clicking the 'Export' button at the top-right of the page.
Responses to quantitative questions such as multiple-choice, rating, ranking, and matrix questions are automatically aggregated and analyzed, while responses to open-ended questions can be summarized with Social Pinpoint's text-analysis tools.
The way responses are analyzed depends on the type of question asked in the form or survey.
The Multi Choice question type lets participants choose one or multiple answers from a list of options configured.
Single Selection: If participants can only select one option, a summary table displays the total count and percentage of each response. The percentages will sum to 100%. A donut chart visualizes the percentage breakdown of all responses.
Multiple Selections:
If participants can select more than one option, the summary table still shows the total count and percentages, but these may not sum to 100%. In this case, a bar chart displays the number of times each option was selected, with longer bars representing more frequently chosen options.

Rating questions ask participants to respond to a question on a visual, stepped scale. A weight is assigned to each step in the scale to determine a weighted average in the results.
A summary table shows the number of times each step of the rating scale (e.g. 1-5, 1-10, etc.) was selected along with the percentage value for each step (percentages will always total 100% across responses), the total count or number of responses and the weighted average score across all responses.
A 'column' visualization shows the percentage breakdown for each rating option, along with the average overall rating score at the upper-right.
Slider questions are similar to rating questions in that they ask participants to respond to a question on a stepped, numerical scale. However, this is done by dragging an interactive slider element along a scale bar rather than selecting the value directly.
Slider questions also allow for negative values, so users can adjust the slider bi-directionally along the scale as opposed to just one way.
The results of a Slider question are shown as a 'column' visualization similar to the Rating question.
A summary table shows the number of times each step of the scale was selected along with the percentage of times it was chosen. Additionally, it shows the total count (which should correspond to the number of times the question was answered), the average and median scores across all responses, and the minimum and maximum values that were selected on the scale.
If the number of steps in the numerical scale exceeds 11, the bar visualization will automatically combine responses into a smaller number of breakpoints, so the graph is still legible. The full, detailed results are visible in the summary table.Ranking questions ask participants to organize a list of items in order of their preference. A weighted average 'score' is calculated for each answer choice, helping you determine the most and least preferred answer choices.
The ‘score’ is calculated by:
- Summing up the weight of each ranked position.
- Multiplying the response count for each position choice.
- Dividing by the total responses of the question.
The 'score' weighs the results by the number of contributions, so outliers do not bias the score. This is particularly useful in cases where the ranking of all options is not required.
Weights are applied in reverse order. In other words, a participant's most preferred choice (which they rank as #1) has the largest weight and their least preferred choice (which they rank in the last position) has a weight of 1.
In addition to the new ‘Score’ calculation a new column to display the ‘Average Rank’ of the choice is also available in the data report. The ‘Average Rank’ is calculated by:
- Summing up the ranked position of the choice,
- Multiplied by the response count for the position choice and then;
- Dividing by the ‘Count’ of the choice.
This change has been applied retroactively to all previous ranking questions, and results reports will be updated.
Matrix questions ask participants to evaluate one or more questions against a common response scale.
A summary table shows results of the questions, with each question listed down the first column and the answer choices listed across the first row. The total number of responses for each answer choice is shown in each cell along with the percentage values which will always total 100%.
Additionally, the summary table shows the total count or times the question has been answered, and the average score for each question. To determine the average score, answer choices are assigned a number value depending on how many choices there are. For example, if a question asks users to respond on a scale with five steps, responses will be assigned a value from 1 to 5 respectively.
A 'bar' visualization plots the average score to indicate were responses fell along the answer scale.
Short Text and Long Text questions collect open-ended, text-based responses from participants.
Before seeing the results for these questions, users must first analyze responses either manually, or automatically through Social Pinpoint's Analysis Assistant. Following this process, the aggregated results are available in the Summary report, shown under three key sections.
Sentiment indicates the overall emotional tone of your responses with results displayed as a 'horizontal' bar visualization showing the distribution across four classifications: positive, mixed, negative, and neutral.
Tags are words or phrases manually assigned to responses that indicate a particular topic, theme or other categories. Results are displayed in a summary table showing the total count and percentage for each tag and visualized as a 'word cloud' providing a visual representation of the most common tags in your responses.
Featured Contributions displays selected responses to the question chosen by the user. They can be used to highlight exemplary responses and provide more context and depth to the analysis.
The summary report for a map question displays the map with all markers placed by participants. Users can click the "View Contributions" button below the map to access detailed responses for that map question.

Hidden Questions 🆕
In the summary section the hidden fields are shown with the number of users that had filled out the form with their respective IDs.

If you have multiple hidden fields they can also be filtered in the reporting interface to see how many users came from each URL.
The hidden fields are not included in the following:
- Not included in text analysis
- Not displayed in the Analysis tab visualisations
- Hidden Fields do not appear in the UI.
- Participants cannot see or edit them.

🔍 Overview
The Overview section provides high-level information about your form or survey, giving you insight into how participants engaged with it and who they were.
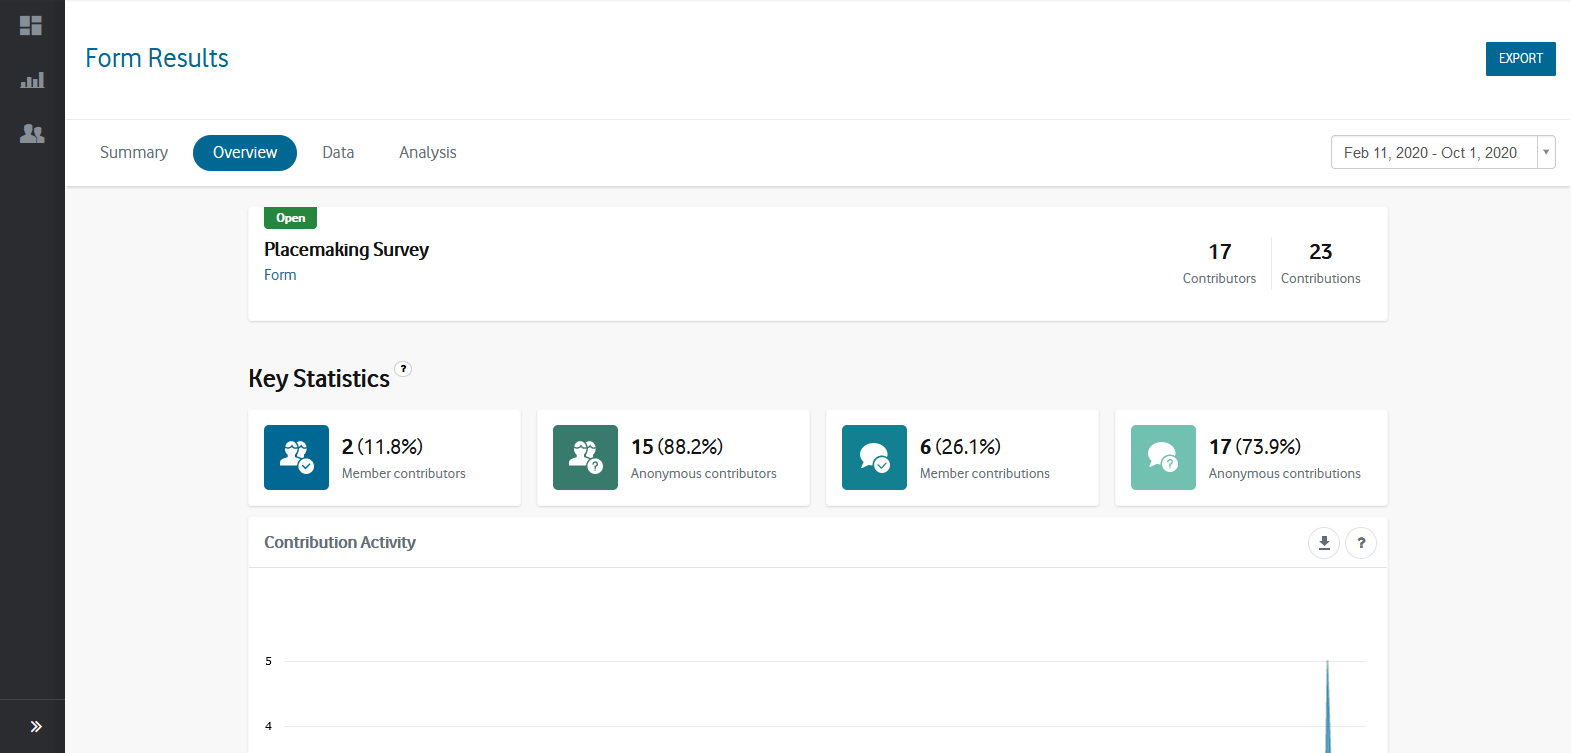
It includes information on:
- Form Details - Provides information about the form or survey including its title, description, whether the form is open or closed and the number of unique contributors and total contributions collected.
- Participant Type - Shows the number of unique contributors and total contributions coming from registered members and anonymous participants.
- Contribution Activity - Provides a 'line' graph showing the total number of contributions collected per day, split between registered members and anonymous participants.
- Technology - Indicates the device types and browser types used by your participants when making a contribution to the form.
- Member demographics - Shows the demographic details of any registered members including age, gender, age by gender, location, and categories and locations of interest.
📈 Data
Form Submissions
The Data section contains the full results of your survey in a tabular format. Each row of the table represents one contribution from a single participant, and each column contains the individual question, member information or other meta-data.
This is where you can:
- View and analyze response data
- Filter results
- Export data for further reporting
- Manage which columns are visible and included in the export
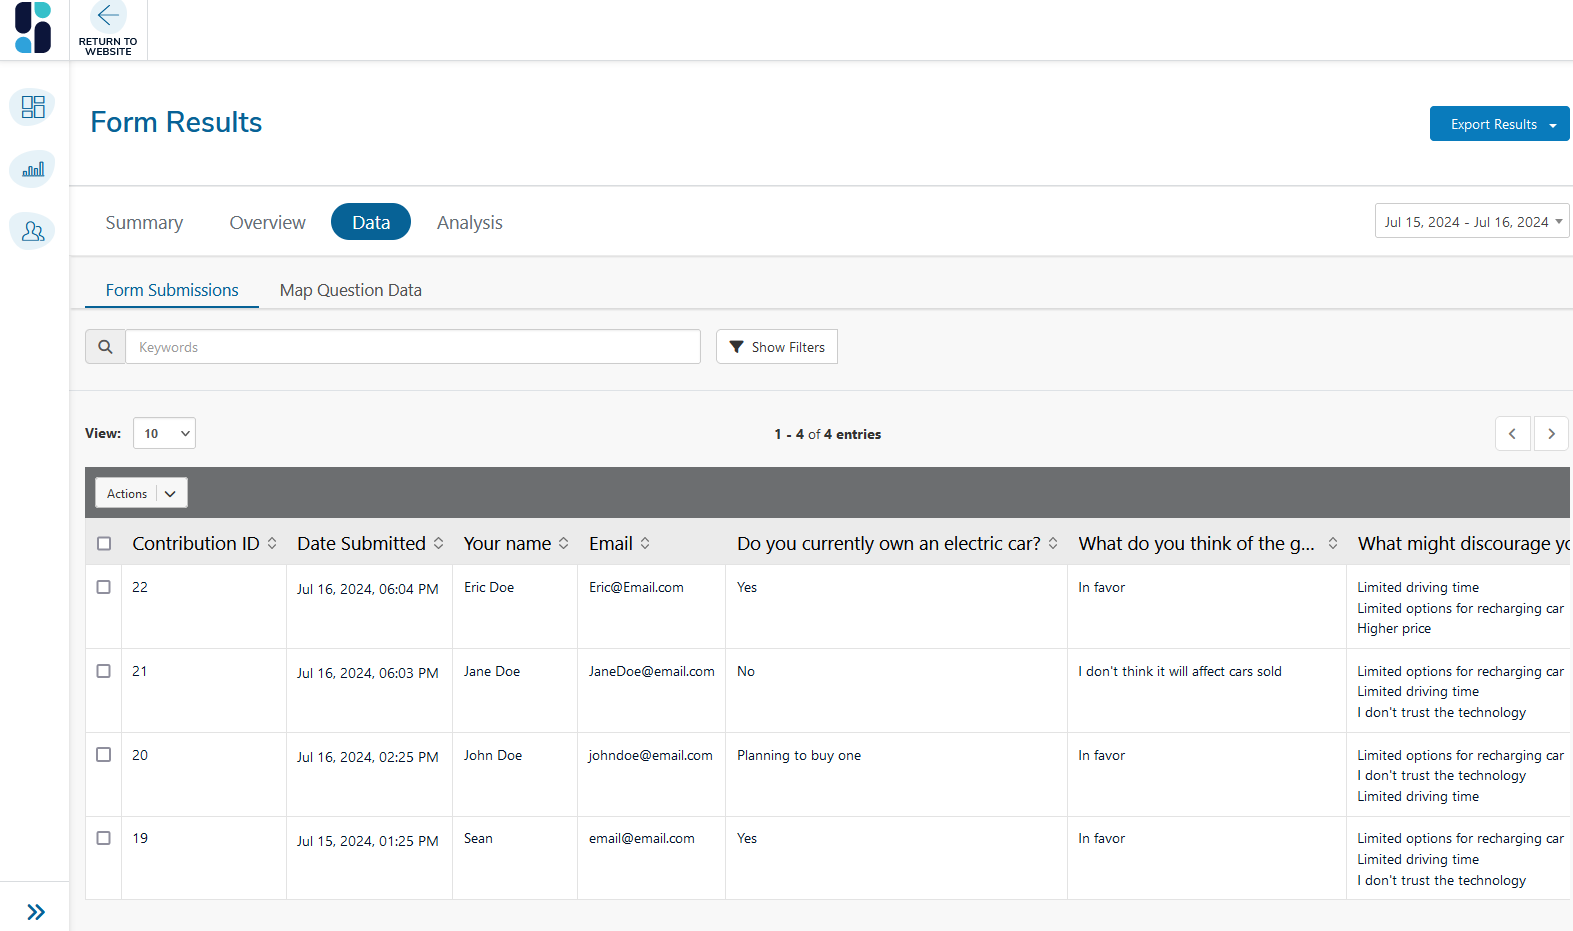
In addition to a column for each question, the following fields are shown in the data table:
- Contribution ID - Provides a unique number to identify the contribution.
- Date Submitted - The date and time the contribution was submitted.
- IP Address - The IP address of the participant, which is 'masked' to protect privacy. This can be used to detect contributions coming from the same place.
- Member Status - Whether the member status is 'Active' or 'Inactive'.
- Member ID - The unique ID number of the member.
- Member Username - The member's unique username.
- Member Email - The member's email address.
Only contributions from participants who are registered members of the site will have data in the member fields. Member data is dynamically copied from a member's user profile meaning it gets updated when their information is changed (via their user profile).
Any custom member fields added to your site (as part of the registration form) are also added to the data table.
Filtering Results
You can filter your data to focus on specific submissions or trends:
- Click Show Filters at the top of the table.
- Select your desired filters (e.g. date range, member status, answers to specific questions).
- Click Apply Filters.
Applied filters will also affect any data you export.
Managing Columns
This function gives you full control over which questions or fields are displayed in the table and included in the exports.
- In the Data section select 'Columns' (opposite of the Actions dropdown).
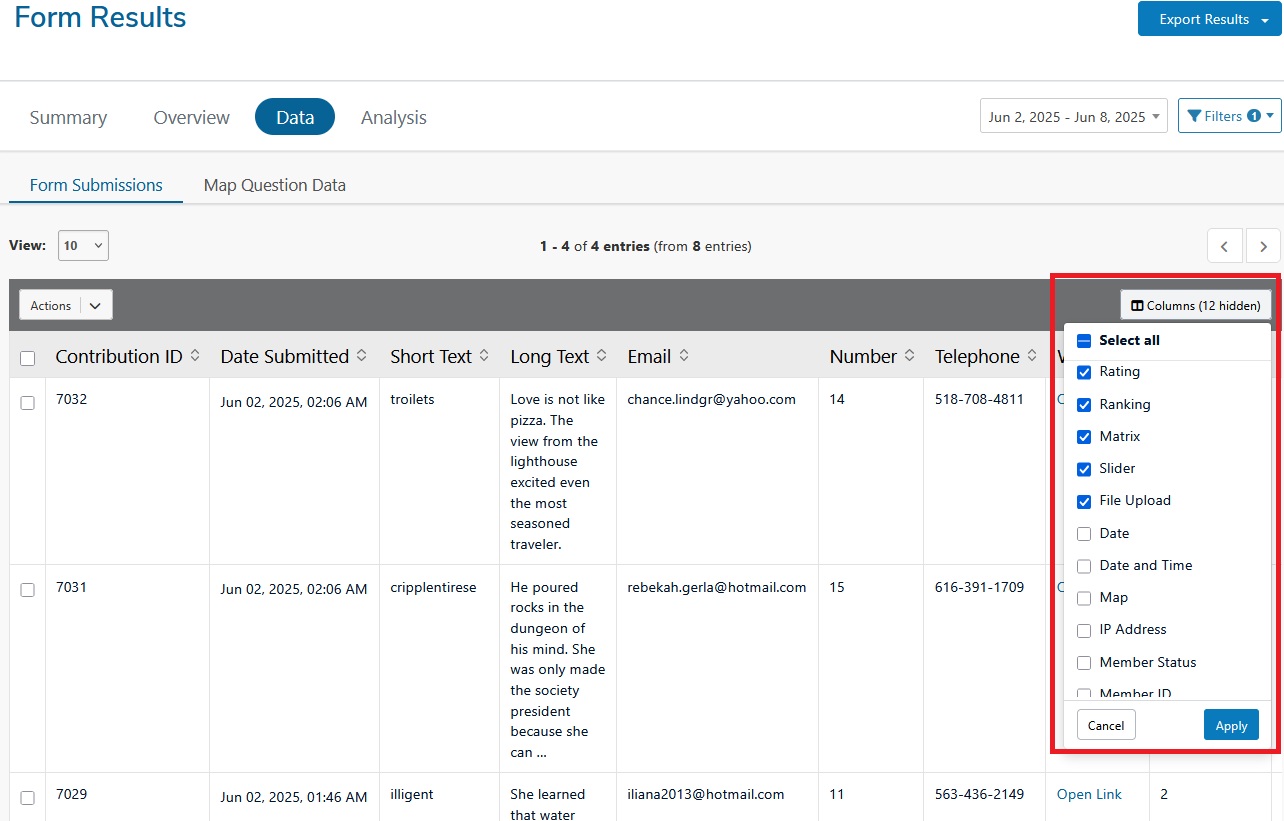
- From the pop-up window, all columns will be selected by default; you can de-select any columns you want to hide.
Note: Any hidden columns will also be excluded from data exports.
-
Click Apply to confirm your selection
You can deselect questions, metadata or member fields. The filter will still apply to the full data set - even if a column is hidden. This feature is particularly useful when preparing reports for specific audiences or when handling sensitive data.
Data Exports
You can export the Form data in the following formats:
- .xls (Excel)
- .csv
To export, apply your filters or manage columns settings as needed, select 'Export' in the top-right corner of the page, then select your desired file type.
💡NOTE: Any filters or column selections you apply will be reflected in the export.
Download Notifications
When exporting large datasets, you will see a notification when your data download is ready. This prevents you from having to wait on a loading or processing screen you can continue working while your export is prepared.
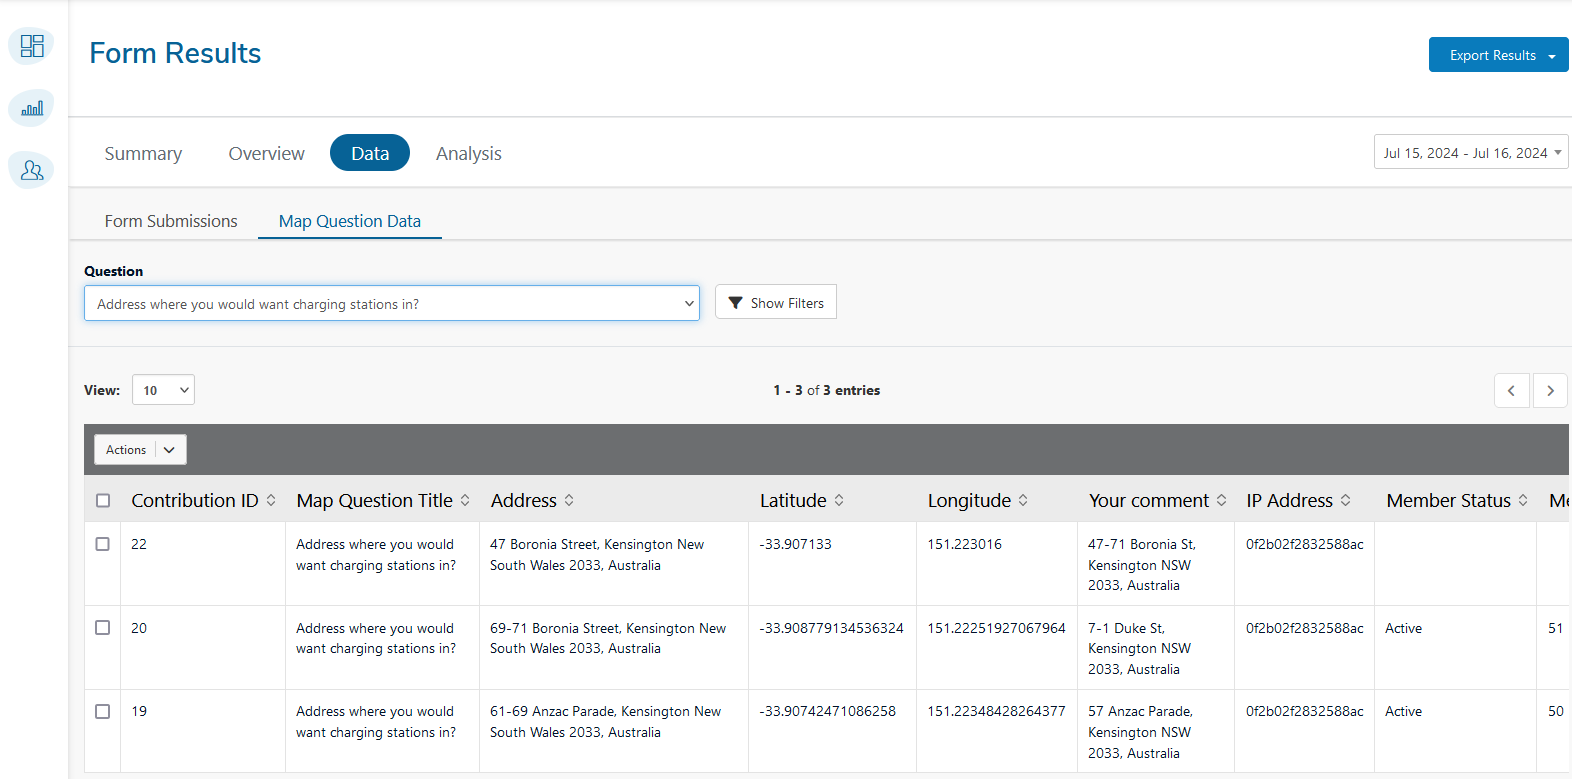
Map Question Data
In addition to the fields common to all data tables, the map question data table includes:
- Map Question Title: The title of the map question.
- Address: The address specified by the participant.
- Latitude: The latitude coordinate of the specified location.
- Longitude: The longitude coordinate of the specified location.
- Your comment: Any additional comments provided by the participant related to the map question.
Below is an example of how the data from a map question might be displayed. This data can be filtered, exported, and analyzed in the same way as other survey data.
🆕Attachment bulk export
This enhancement adds a new option to the Export Results button in the Data tab for tools that allow file uploads. Site users can now bulk export all attachments provided by participants instead of downloading them one by one. All exported files are delivered in a ZIP package with consistent naming conventions so that attachments are easy to identify and keep organized.
In the Results → Data tab, a new option will be available under Export Results > attachments.
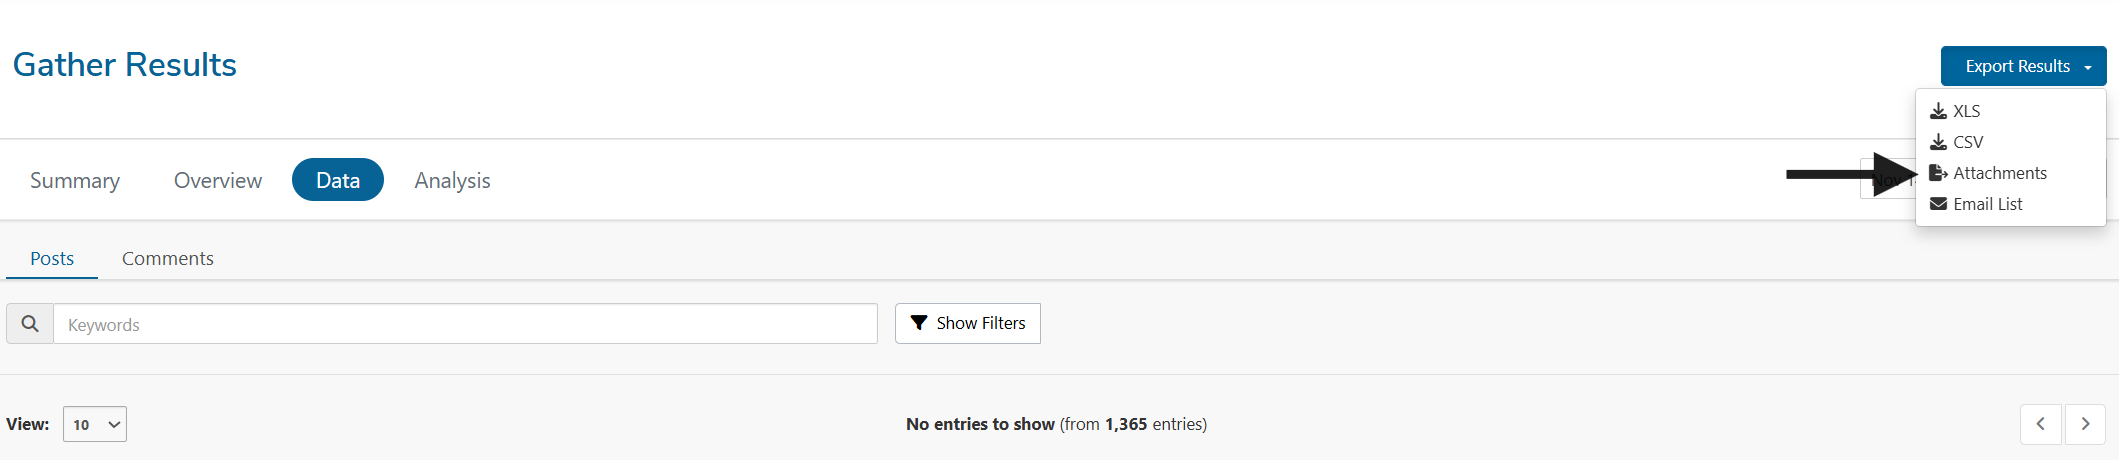
The file name follows the standard naming convention used in existing exports.
For example:
2024-01-01_Gather-ID-123_project-name.zip
Single upload question tools (e.g. Gather): All files are stored in the root folder.
File naming follows the pattern:
{CONTRIBUTION_ID}_{ORIG_FILENAME}
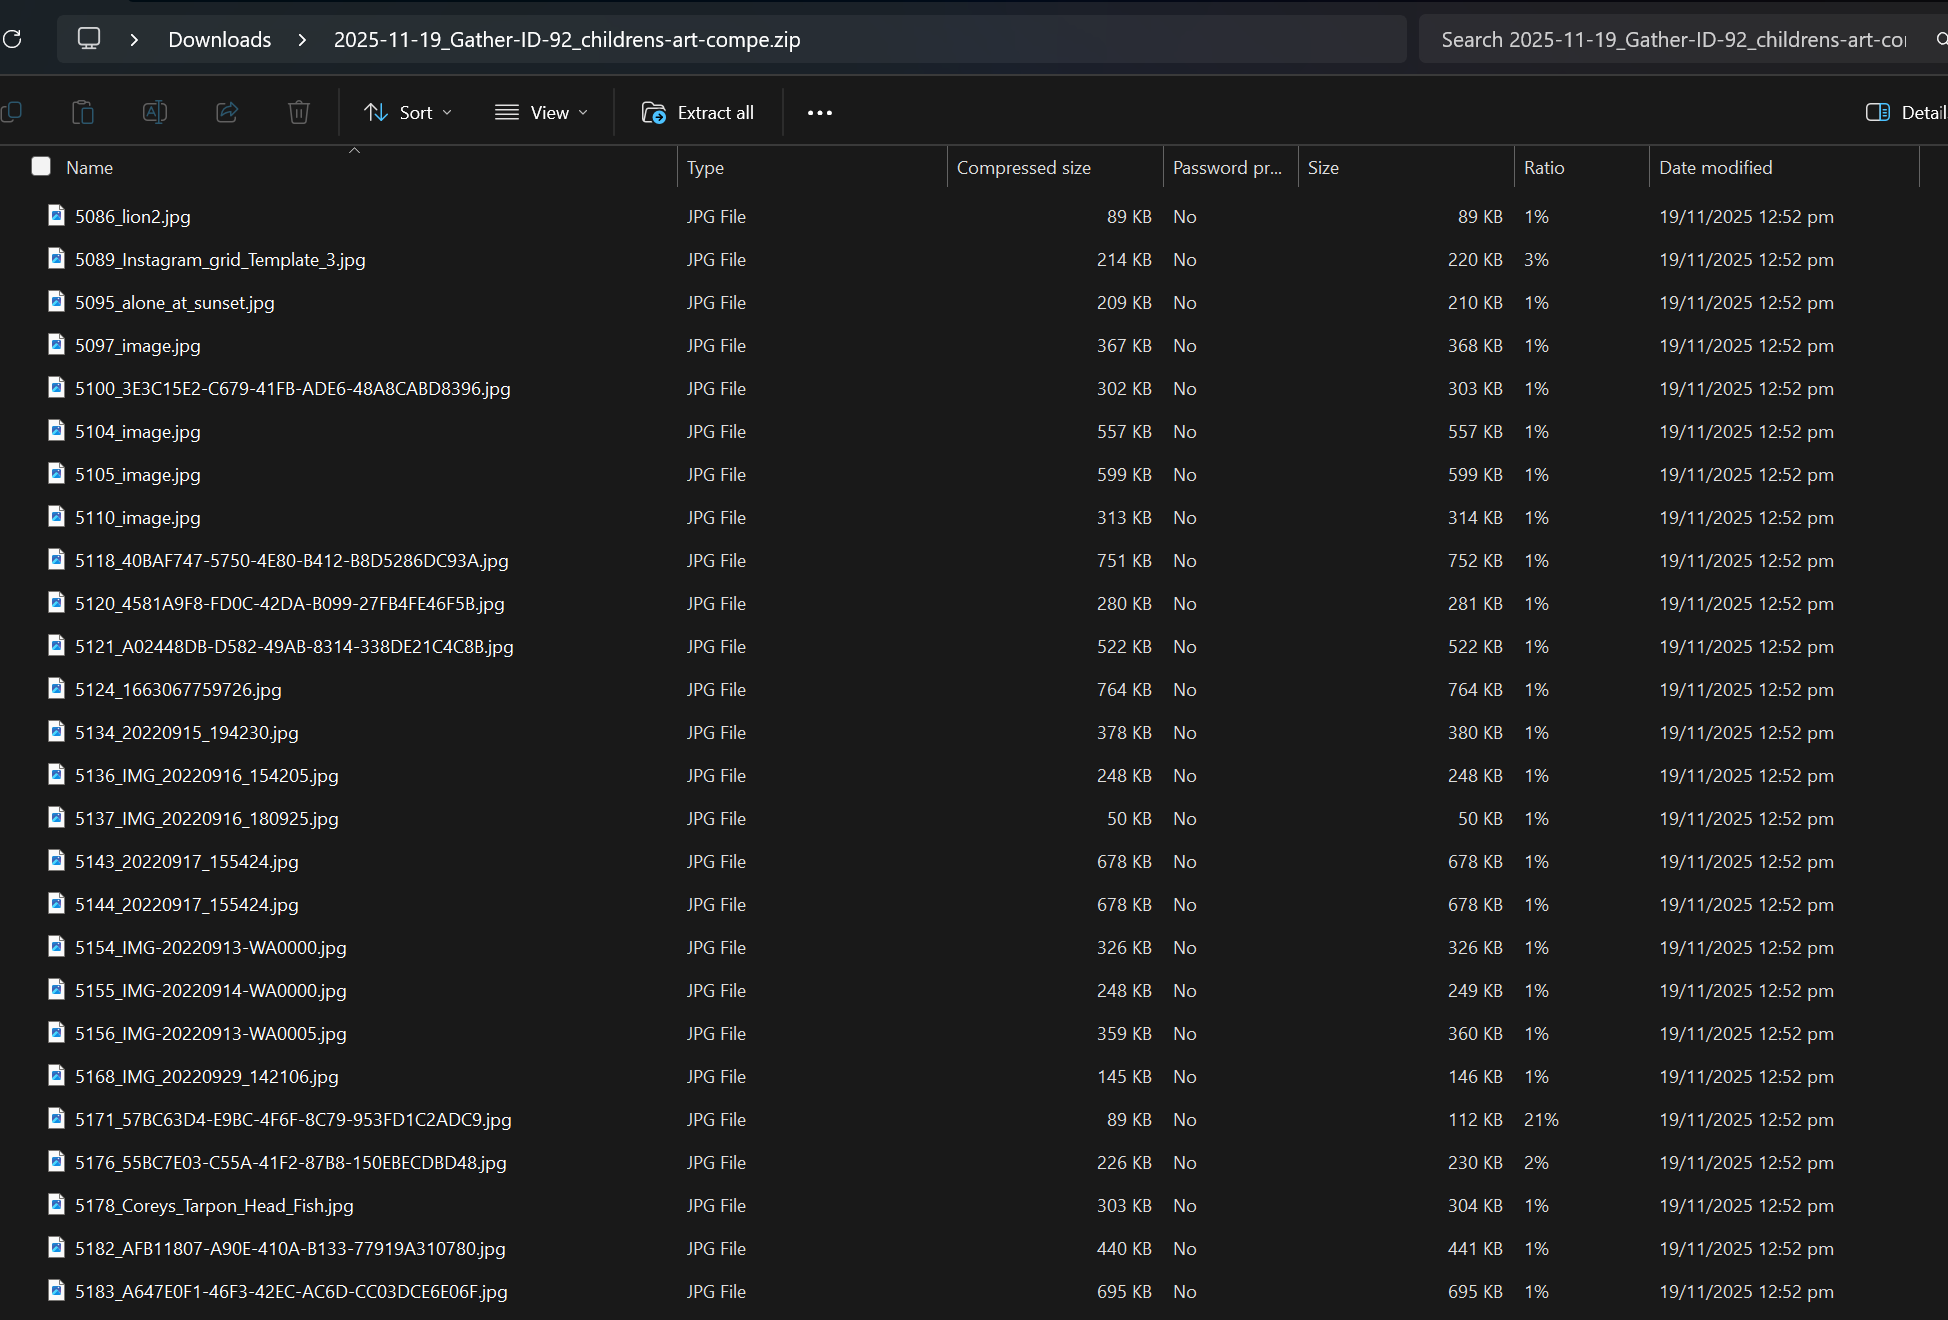
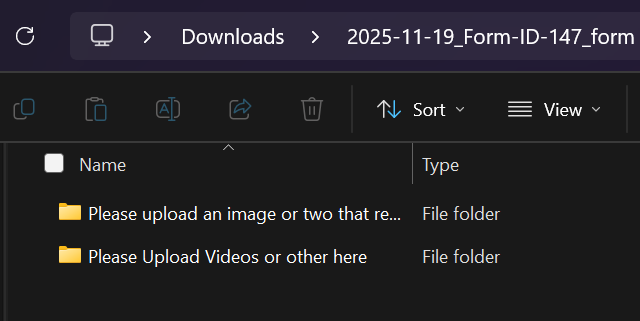
Multi-upload question tools (e.g. Form, Social Map): Files are grouped by question folder.
Folder naming follows the pattern:
{QUESTION_TITLE}(indexed if duplicate titles exist)
File naming follows the pattern:
{CONTRIBUTION_ID}_{FILE_INDEX}_{ORIG_FILENAME}
Duplicate handling follows the existing pattern, for example:
123_1_image.jpg,123_1_image (2).jpg
📊 Analysis
The Analysis section lets you view individual text-based responses collected through any Short Text or Long Text questions in your forms. It also contains a number of tools that help you analyze the data, so you can summarize and present results for qualitative questions.
The following fields are shown in the data table:
- ID - Provides a unique number to identify the response.
- Date submitted - The date and time the response was submitted.
- Question - The question title that participants responded to.
- Contribution - The response submitted to the question.
- Sentiment - The sentiment classification assigned to the response ('positive', 'mixed', 'negative', and 'neutral').
- Tags - Words or phrases assigned to the response as determined by the user.
- Featured - Responses that are selected to appear in the 'Featured Contributions' section of the Summary report.
- Actions - Additional functions that allow you to view the entire contribution and its data in a pop-up window.
All responses can be viewed together, or filtered by individual question by selecting the 'Question' dropdown at the top of the table. Clicking the 'Show Filters' button provides additional options to filter responses such as 'Tags', 'Sentiment' and whether the response is 'Featured'. Once filters have been selected, click the 'Apply Filters' button.
Data can be exported as .xls or .csv by clicking the 'Export' button at the top-right of the page, and selecting the desired file type. Any filters you have applied to the data table will also be applied in the data export.
- Example PDF report for Form tool PDF (2.81 MB)
-
MS Excel (21.40 KB)
⚠️ IMPORTANT:
-
If you want to test the survey/form you are building, please use the preview button within the tool. Do not test in the actual page.
-
Social Pinpoint staff will not delete data from Form reports without good reason. This includes test data as a preview function is available.
-
The Form tool does not allow Users to remove, change or manipulate submitted data. This is for openness and transparency reasons.